Do not open today
PRODUCT
Passenger Car
SUV
VAN &
Light Truck
Winter
Racing
Global OE
EV Root Technology
Solid Tire
Tube&Flap
Awards
Magazine Test
NEXEN
Technology
SERVICE
Tire Finder
Warranty
Tire Guide
Tire Labelling
Regulation
COMMUNICATION
Brand
Sports Marketing
MotorSports
AD & Exhibition
Download
Social
Contents Room
NEWS
Newsroom
NEXEN TIRE
Company
Contact Us
SUSTAINABILITY
Sustainability Management
Environment
Social
Governance
Ethics
Resources
INVESTOR RELATIONS
Financial Information
Stock Information
IR Information
Global Site
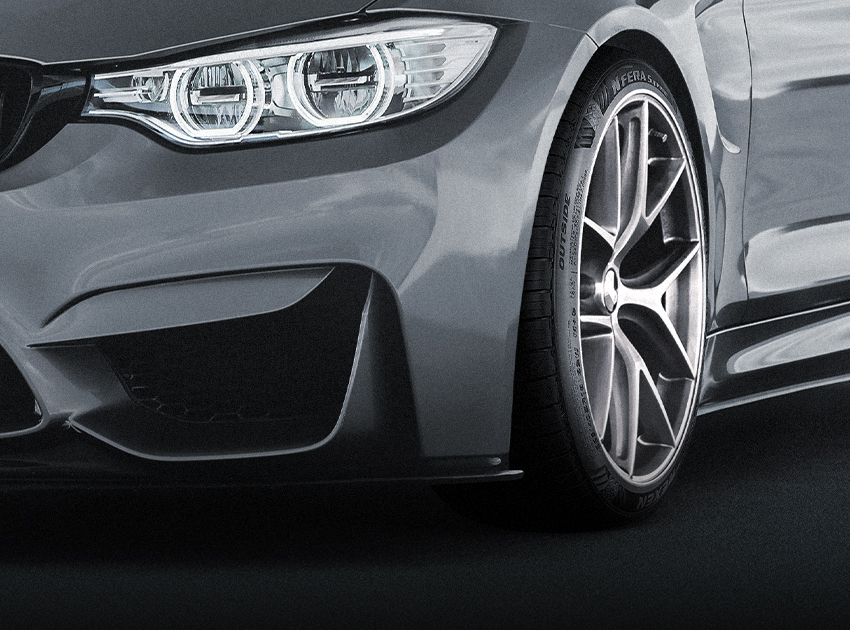
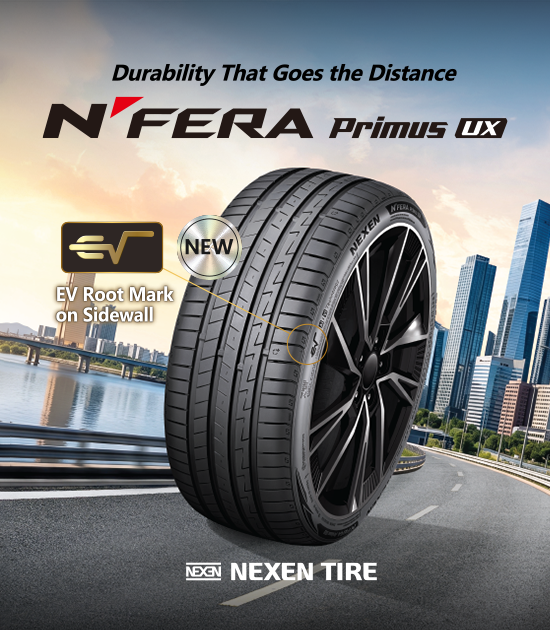
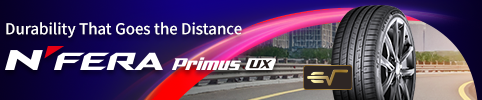
High Quality, High Performance
Premium-Comfort Ultra High Performance
Read more
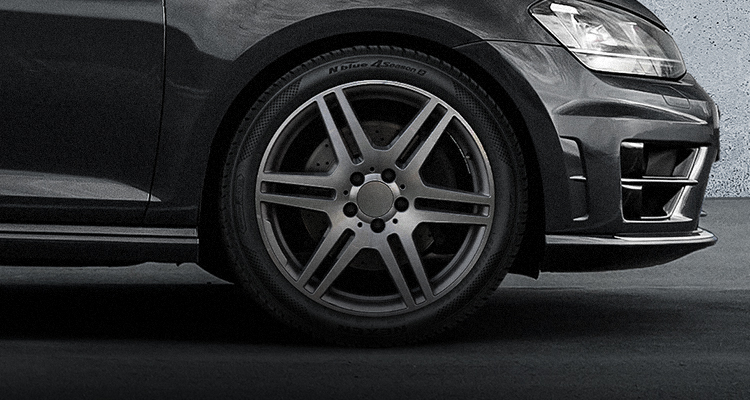
New All-season Tire for European Road Conditions
Read more
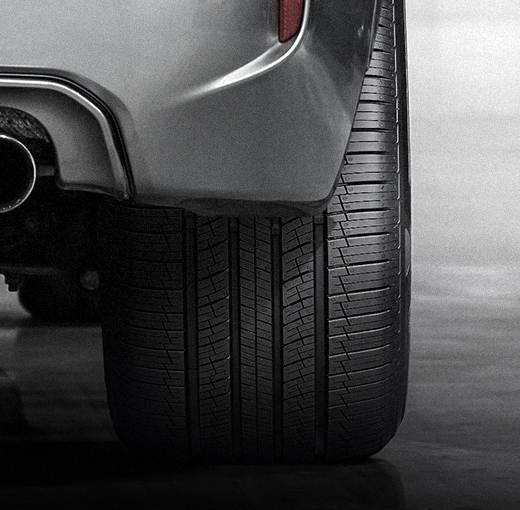
Premium SUV and Crossover All-season Tire
Read more
Product
Check out the various products of NEXEN TIRE
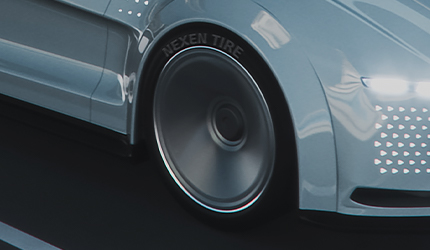
EV Compatible
Read more
Passenger Car
Read more
SUV
Read more
Winter
Read more
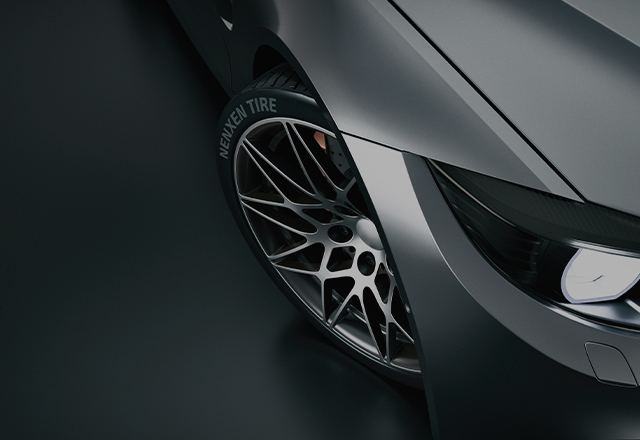
Why NEXEN TIRE
Meet NEXEN TIRE, which is based on its globally
excellent technology and know-how
Leap to the world
NEXEN TIRE STORY
Read more
open up the future
NEXEN TECHNOLOGY
Read more
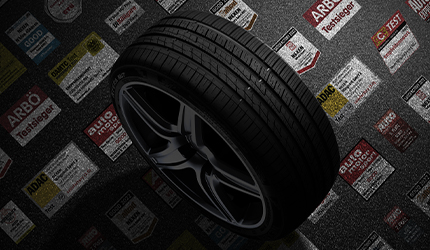
Recognized for the best quality
MAGAZINE TEST
Read more
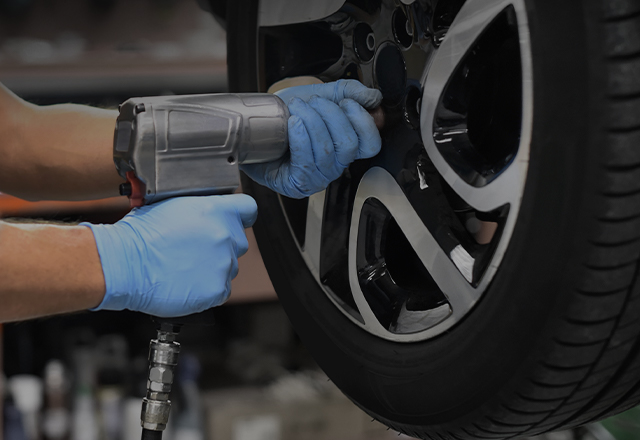
SERVICE
Warranty
INFORMATION
Tips for Tire Management
NEWS
Newsroom
SPORTS MARKETING
Manchester City
SPORTS MARKETING
SuperRace Championship
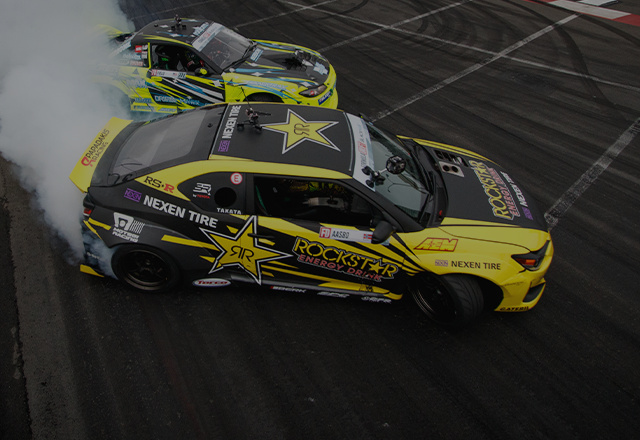
SPORTS MARKETING
US Formula Drift
facebook
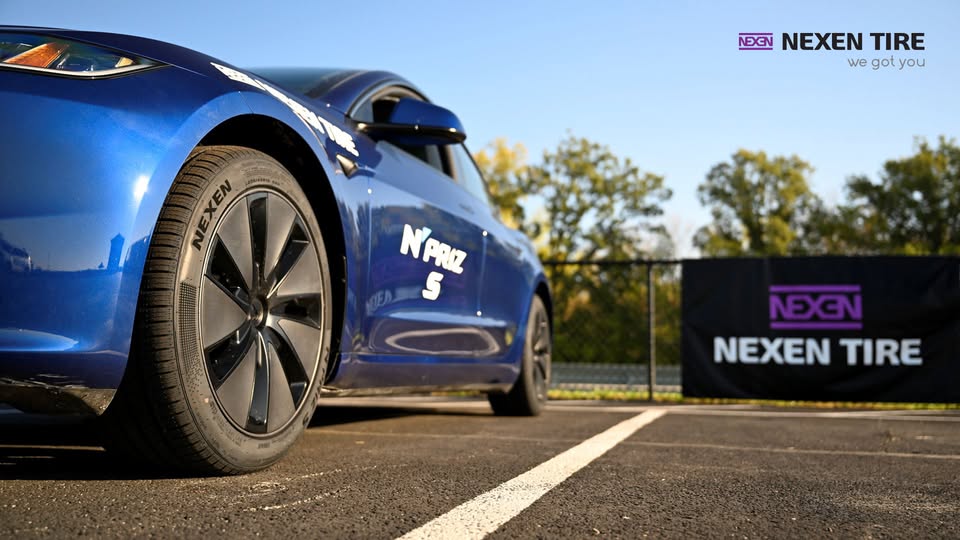
NEXEN TIRE Rolls Out Two New Tires with Dual Rollout at Ride N’ Drive and SEMA 2025
NEXEN TIRE’s two all-new passenger tires, N’PRIZ S and N’FERA Sport, were introduced through a dual rollout that began at the company’s exclusive Ride N’ Drive experience and continues this November at the 2025 SEMA Show in Las Vegas.
2025.11.05
Instagram
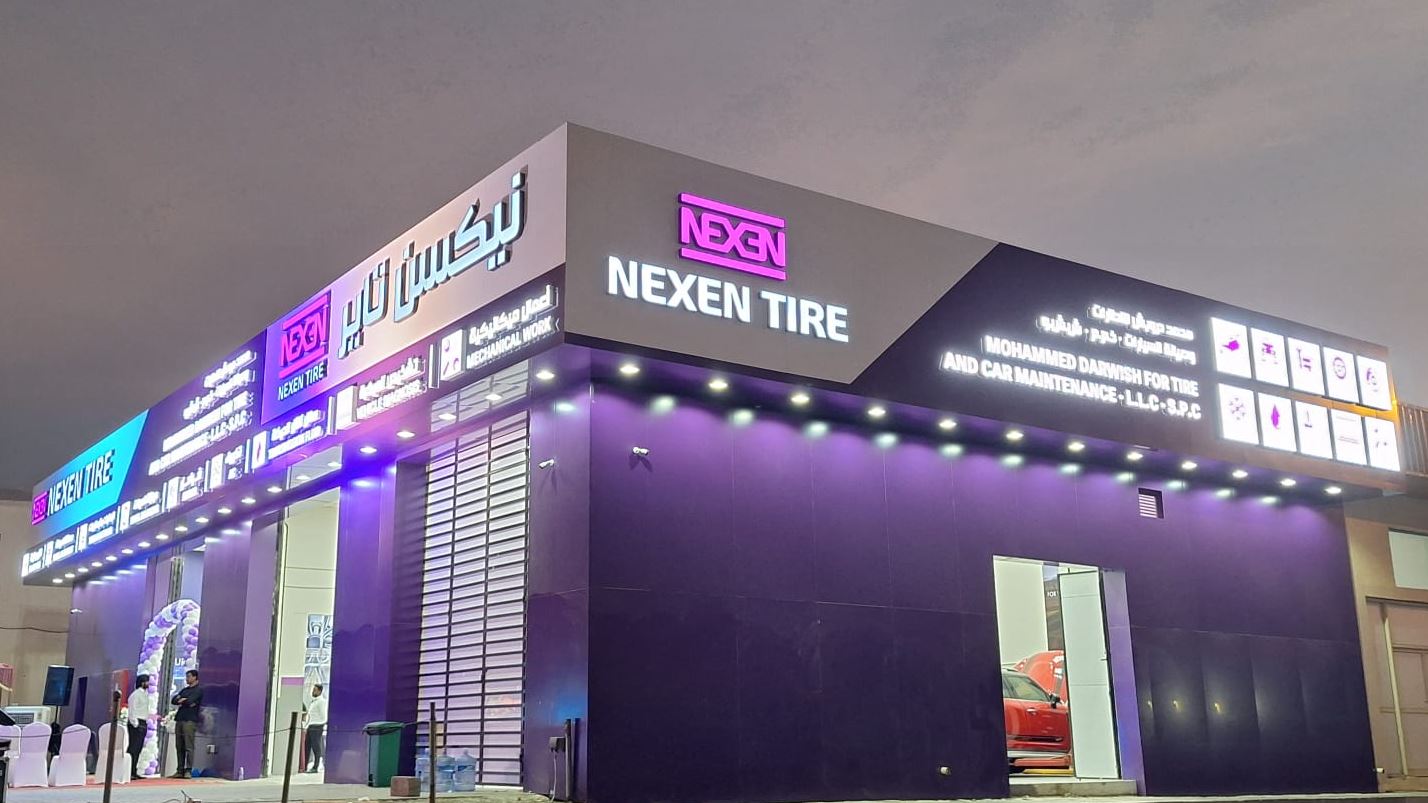
NEXEN TIRE Strengthens Global Brand Presence with Strategic Shop Branding Project
NEXEN TIRE has opened its first branded shops in Bahrain and Kuwait, marking a significant milestone in its expansion across the Middle East. 🚩
2025.11.03
Youtube
[FCB] Tongue Twister with Leon Goretzka
NEXEN TIRE has teamed up with FC Bayern midfielder Leon Goretzka for a fun and playful tongue-twister moment! Check out the video and enjoy a lighter, more entertaining side of the game with us.⚽
2025.11.20
Tire Finder
Warranty System
TOP
Refresh
Close
Please enter your vehicle model, size, and nearest city, county, or district
※ Please enter 225/50R16 when entering tire size
Tire Search Results
---
We found tires matched to
※ Select a tire size to view more detailed tire information.
Find tires for my car
Tire search results
---
We found tires for
※ Select a tire size to view more detailed tire information.
Find tires for my car
Dealer search results
---
We found a dealer near
※ You can find more dealers by region.
Find a dealer