


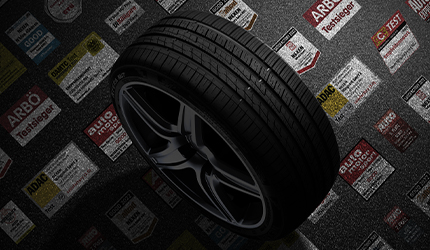

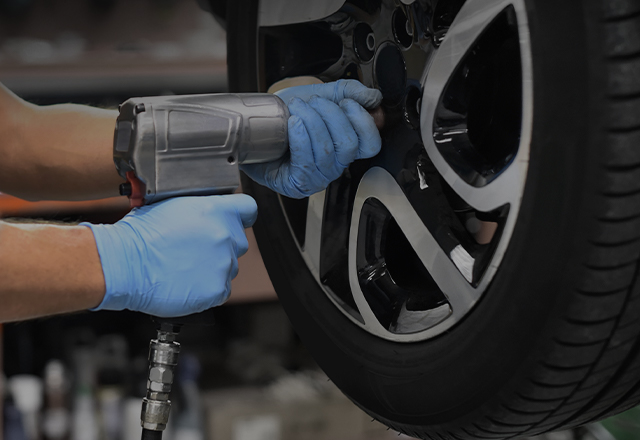


High Quality, High Performance
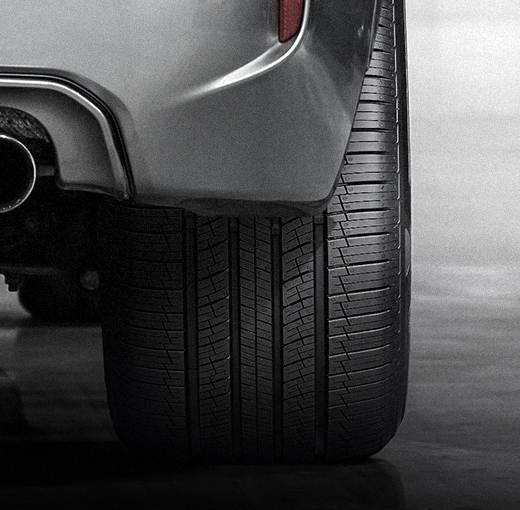
Product
Check out the various products of NEXEN TIRE
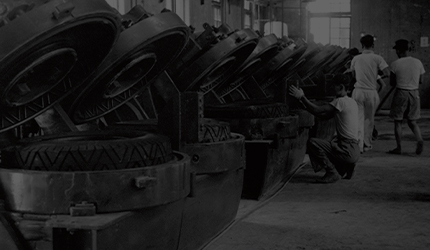
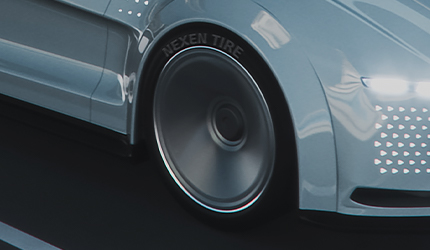
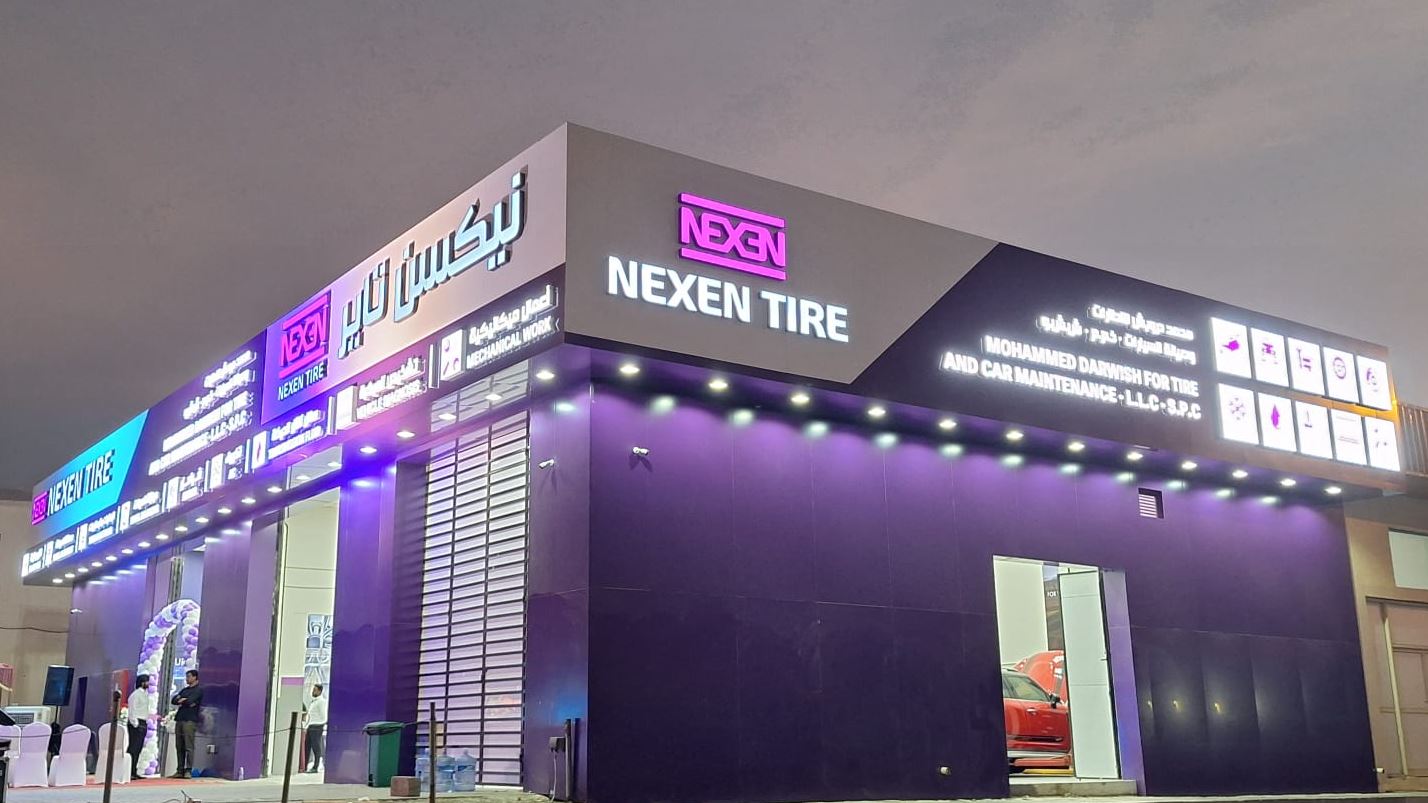
Why NEXEN TIRE
Meet NEXEN TIRE, which is based on its globally
excellent technology and know-how
excellent technology and know-how