| Financial Information | Stock Information | IR Information |

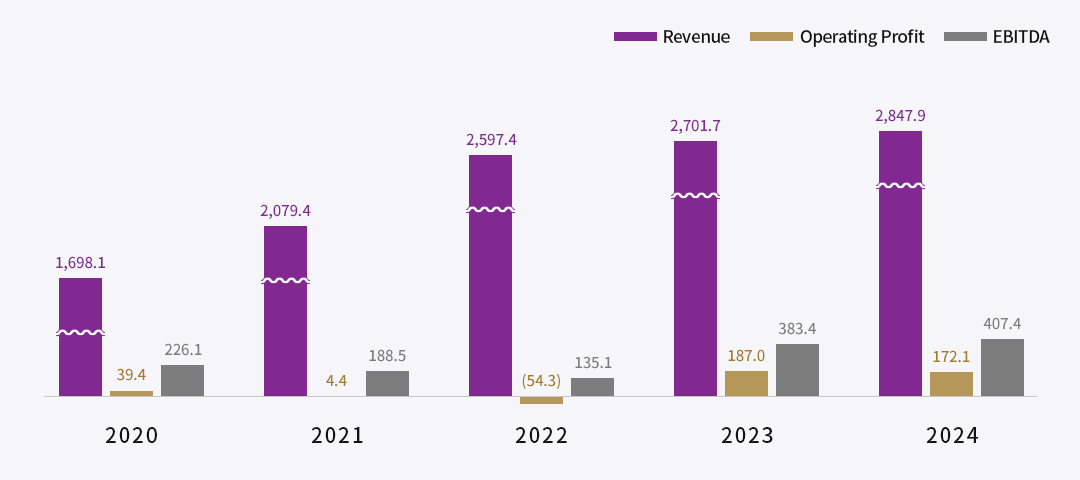
| Category | 2020 | 2021 | 2022 | 2023 | 2024 |
|---|---|---|---|---|---|
| Revenue | 1,698.1 | 2,079.4 | 2,597.4 | 2,701.7 | 2,847.9 |
| COGS | 1,259.8 | 1,639.8 | 2,165.9 | 1,962.4 | 2,055.0 |
| SG&A | 398.9 | 435.2 | 485.8 | 552.3 | 620.8 |
| Operating Profit | 39.4 | 4.4 | (54.3) | 187.0 | 172.1 |
| EBITDA | 226.1 | 188.5 | 135.1 | 383.4 | 407.4 |
| Income Before Income Tax | (12.7) | 16.5 | (40.3) | 149.7 | 169.8 |
| Income Tax | 3.9 | 11.8 | (12.8) | 46.6 | 43.1 |
| Net Income | (16.6) | 4.6 | (27.5) | 103.1 | 126.7 |
| Common Stock EPS(KRW) | (162) | 45 | (268) | 1,001 | 1,231 |
| Category | 1Q25 | 2Q25 | 3Q25 | 4Q25 |
|---|---|---|---|---|
| Revenue | 771.2 | - | - | - |
| COGS | 569.6 | - | - | - |
| SG&A | 160.9 | - | - | - |
| Operating Profit | 40.7 | - | - | - |
| EBITDA | 99.5 | - | - | - |
| Income Before Income Tax | 47.5 | - | - | - |
| Income Tax | 7.6 | - | - | - |
| Net Income | 39.9 | - | - | - |
| Common Stock EPS(KRW) | 387 | - | - | - |
| Category | 2020 | 2021 | 2022 | 2023 | 2024 |
|---|---|---|---|---|---|
| Current Assets | 1,200.3 | 1,476.0 | 1,442.1 | 1,556.1 | 1,875.1 |
| Non-current Assets | 2,340.8 | 2,347.4 | 2,502.2 | 2,676.6 | 2,699.4 |
| Total Assets | 3,541.1 | 3,823.4 | 3,944.3 | 4,232.7 | 4,574.5 |
| Current Liabilities | 766.8 | 1,041.7 | 1,431.7 | 1,330.0 | 1,454.3 |
| Non-current Liabilities | 1,227.4 | 1,181.8 | 916.4 | 1,197.8 | 1,248.6 |
| Total Liabilities | 1,994.1 | 2,223.5 | 2,348.1 | 2,527.8 | 2,702.9 |
| Equity Capital | 54.1 | 54.1 | 54.1 | 54.1 | 54.1 |
| Premium on Common Stock | 42.2 | 42.2 | 42.2 | 42.2 | 42.2 |
| Capital Surplus | 1,400.7 | 1,421.5 | 1,424.1 | 1,505.8 | 1,605.9 |
| Accumulated Other Comprehensive Income | 23.9 | 55.6 | 46.0 | 72.1 | 137.8 |
| Other Capital | 22.3 | 22.3 | 22.3 | 22.3 | 22.3 |
| Minority Interest | 3.8 | 4.3 | 7.6 | 8.5 | 9.4 |
| Total Capital | 1,547.0 | 1,599.9 | 1,596.2 | 1,704.9 | 1,871.6 |
| Category | 1Q25 | 2Q25 | 3Q25 | 4Q25 |
|---|---|---|---|---|
| Current Assets | 2,012.7 | - | - | - |
| Non-current Assets | 2,748.1 | - | - | - |
| Total Assets | 4,760.8 | - | - | - |
| Current Liabilities | 1,625.3 | - | - | - |
| Non-current Liabilities | 1,220.7 | - | - | - |
| Total Liabilities | 2,846.0 | - | - | - |
| Equity Capital | 54.1 | - | - | - |
| Premium on Common Stock | 42.2 | - | - | - |
| Capital Surplus | 1,632.2 | - | - | - |
| Accumulated Other Comprehensive Income | 154.5 | - | - | - |
| Other Capital | 22.2 | - | - | - |
| Minority Interest | 9.6 | - | - | - |
| Total Capital | 1,914.8 | - | - | - |